Agricultural Literacy Curriculum Matrix
Lesson Plan
Pizza Time!
Grade Level
Purpose
Students use pizza as a basis for exploring agriculture, geography, and mathematics. Grades 3-5
Estimated Time
Materials Needed
Activity 1: Fabulous Fractions and Pizza Probability
- Pizza Starts on the Farm activity sheet
Activity 2: Pizza in Real Time
- Ingredients—Where Do They Come From? handout
- In Real Time activity sheet
- Pizza Time Bulletin Board (optional)
Activity 3: Pizza Math
- My Favorite Pizza activity sheets
Activity 4: Cracker Pizzas
- Crackers
- Pizza sauce
- Cheese, pepperoni, and pizza toppings of your choice
Vocabulary
farm: an area of land used for growing crops or rearing animals
Background Agricultural Connections
Farming and agriculture are a part of everyone’s life in one way or another. From the job you might have someday to the lunch you eat today—many things in our lives are related to agriculture.
Take a look at a typical school cafeteria lunch of ham, corn, tater tots, chocolate pudding, and a bread roll. Each part of the meal is related directly to agriculture. Milk comes from cows on a dairy farm and is pasteurized at a dairy plant. Ham is a pork product that comes from pigs, and bread is made from flour, a product of wheat. Wheat is grown and harvested on a farm, then ground to make flour at a mill. Corn is also grown on a farm, as are the potatoes that were shredded for the tater tots. The corn was probably canned in a factory, while the potatoes were peeled, shredded, cooked, frozen and packaged at a different factory before being shipped to the school. Even the chocolate pudding is made of milk, soybeans, and corn from farms.
As you go through this lesson, remind students that all food begins on the farm. Now it’s pizza time!
Engage
- Ask students to identify their favorite pizza toppings. List them on the board.
- Ask your students if they know where the pizza toppings came from.
- Inform your students that they will do the following:
- Identify where pizza ingredients were produced;
- Calculate how long it takes to produce pizza ingredients beginning with production on the farm;
- Practice skills in division and graphing using the pizza; and
- Locate the states where pizza ingredients were produced.
Explore and Explain
Activity 1: Fabulous Fractions and Pizza Probability
- Have students complete the Pizza Starts on the Farm activity sheet.
Activity 2: Pizza in Real Time
- Share the information from the attached Ingredients—Where Do They Come From? handout with students, and have them consider the time it actually takes to produce a pizza. Then have them complete the In Real Time activity sheet.
- Optional: Use the Pizza Time Bulletin Board to have your students use the skill of "telling time" with the time it takes to grow, process, and produce the ingredients of a pizza. The bulletin board can easily be used to teach concepts of time, community involvement, raw to finished products, careers, and much more.
Activity 3: Pizza Math
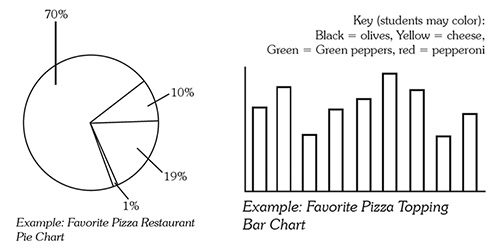
- Have students interview their classmates about what their favorite pizza toppings and/or pizza restaurants are and graph the results. You may use the My Favorite Pizza activity sheets included with this lesson, or you may simply use them as a guideline for other interview questions and charts that your students may enjoy.
- This is also an opportunity to introduce or review with your students how to read and create different types of graphs for different kinds of data.
Activity 4: Cracker Pizzas
- To conclude the lesson, provide ingredients for students to build their own cracker pizza. As each ingredient is distributed, review with students where the ingredient originated or how it was produced or processed.
- Display a map of the United States and have students locate the state that is the top producer of that pizza ingredient. As each state is identified, point out it's characteristics such as climate and open space. Explain to students that pizza ingredients, with the exception of pineapple, can be produced in any state. However, some states, due to their climate or other available resources can produce certain food products more efficiently. For example, California is the highest producing state for milk, peppers, and tomatoes. California's warm and temperate climate makes farming very easy and efficient. Tomatoes and peppers can grow in any state, but the natural growing season may be too short, requiring the added expense of using a greenhouse. Cattle require open land and pastures to graze. Texas is a large state that can provide the open space for cattle to grow.
- Pizza Crust (cracker): The primary ingredient of a pizza crust is wheat. Kansas is the highest wheat producing state in the United States.
- Pizza Sauce: The primary ingredient of pizza sauce is tomatoes. California produces the most tomatoes for commercial sale.
- Pepperoni: Pepperoni is seasoned beef and pork meat. Texas produces the most beef cattle of any state. Iowa is the highest producing state for market pigs.
- Peppers: California is the leading producer of peppers.
- Cheese: California is the leading producer of milk. Cheese is one of many dairy products produced from milk.
- Mushrooms: Pennsylvania is the leading producer of mushrooms.
- Pineapple: Hawaii is the leading producer of pineapple in the United States. Pineapples require a tropical climate to grow.
- When all toppings have been distributed, allow students to eat their cracker pizzas.
Elaborate
-
Have the class interview their friends and families or ask another class in a different town (or even another state) to conduct the same survey and compare the results. Another option would be to survey local pizza restaurants and compare their responses.
-
Use the Pizza Reader or Pizza Ag Mag for reading time.
Evaluate
After conducting these activities, review and summarize the following key concepts:
- All food products (including pizza) begin on the farm, are processed, and then sold to consumers.
- The ingredients to make a pizza take months and even years to grow on the farm before the pizza can be assembled.
Acknowledgements
- Activity 4 was contributed by Mary Jo Baitinger, Marshall County Iowa Agriculture in the Classroom.
- Statistics in Activity 4 were reported by Crop Production 2014 Summary (January 2015) 5 USDA, National Agricultural Statistics Service
Recommended Companion Resources
Author
Organization
 |
We welcome your feedback! If you have a question about this lesson or would like to report a broken link, please send us an email. If you have used this lesson and are willing to share your experience, we will provide you with a coupon code for 10% off your next purchase at AgClassroomStore. |